R4CR

Day1 - tidyverse2 | 2023-06-19
Jinhwan Kim

Overview

Data management with Tidyverse

  1. 데이터를 읽고 readr

  2. 데이터를 정리하고 dplyr

  3. 통계 분석을 실행하고 purrr (워크샵에선 안 다룸)

  4. 결과를 만들고 ggplot2

  5. 외부에 공유 rmarkdown, quarto, shiny

몰라도 baseR로 할 수 있지만, 알면 편해진다.

readr

  • (로컬의) 파일을 (R로) 읽어오는 용도
# install.packages('readr')
library(readr)

?read_csv() # read.csv()

read_csv(
  I("x,y\n1,2\n3,4"), # as Object not Character
  col_types = "dc" # Double / Character
)
  • 주요 파라미터
    • file, col_names
    • col_types. character, integer, number, double, logical, factor, Date, time, _, - : Skip
    • na: NA로 처리할 글자. , na, 999, -
    • col_select : 읽을 column (select)
    • skip
    • n_max

readr & 3 Core function

  • read_csv(): Comma(,)로 구분된 데이터

  • read_tsv(): Tab(\t) 으로 구분된 데이터

  • read_table(): 공백( ) 으로 구분된 데이터

  • 대신 쓸 수 있는 방법

    • base R: read.csv(), read.delim(), read.table()
    • data.table : fread()
  • base R vs readr

    • 보통 10~100배 빠른 속도
    • col_names, col_types vs header, colClasses
    • date / time을 인식
    • Progress bar (진행 상황 ::…)
  • read_csv() vs fread()
    • 데이터가 클 수록 fread()가 빠름
    • delimiter, skipped row, header를 설정하지 않아도 됨
    • tidyverse (tibble) 과의 연계

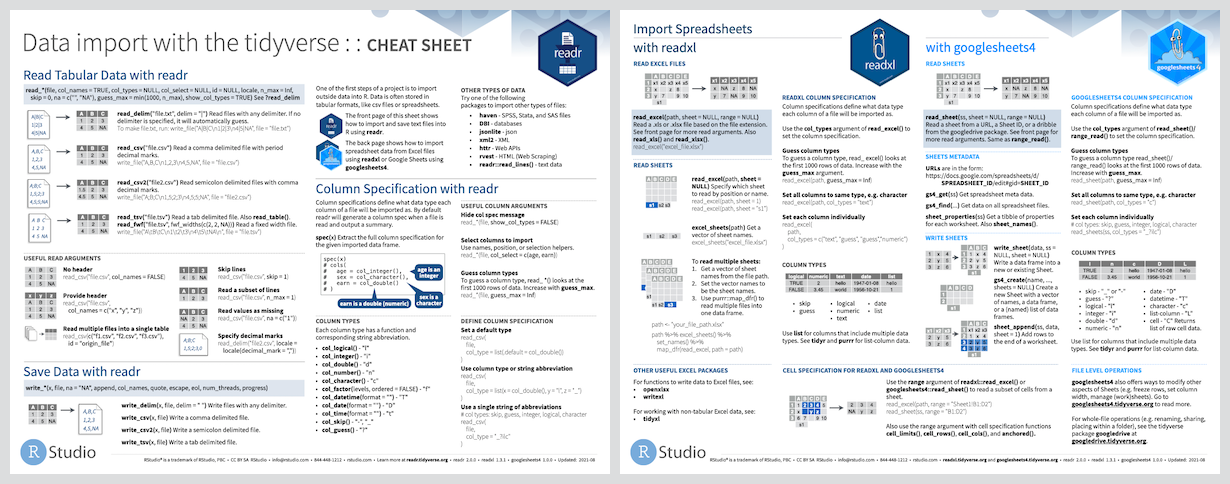
readr cheat sheet 다운로드

dplyr

  • d(ata)-plyr
  • 기록 시점의 데이터와 분석에 필요한 데이터는 다름
    • 필요하지 않은 데이터
    • (지표등을) 계산, 추가해야 하는 경우
library(dplyr)

starwars %>% 
  filter(species == "Droid") %>%
  mutate(bmi = mass / ((height / 100) ^ 2)) %>%
  select(name:mass, bmi) %>% # name 에서 mass 까지 + bmi 
  arrange(desc(mass)) # Decrease. desc는 %>%로 안쓰는 것이 좋음

starwars %>%
  group_by(species) %>%
  summarise(
    n = n(), # count
    mass = mean(mass, na.rm = TRUE)
  ) %>%
  filter(
    n > 1,
    mass > 50
  )

dplyr & 5 Core function

  1. mutate(): 새로운 Column 추가

  2. select(): 조건에 따라 Column 선택

  3. filter(): 조건에 따라 Row 선택 (base R의 subset과 비슷)

  4. group_by() & summarise(): 요약 (통계치) 계산

  5. arrange(): Row 순서 변경 (정렬)

dplyr - filter

head(iris)
  Sepal.Length Sepal.Width Petal.Length Petal.Width Species
1          5.1         3.5          1.4         0.2  setosa
2          4.9         3.0          1.4         0.2  setosa
3          4.7         3.2          1.3         0.2  setosa
4          4.6         3.1          1.5         0.2  setosa
5          5.0         3.6          1.4         0.2  setosa
6          5.4         3.9          1.7         0.4  setosa
iris %>% 
  filter(Sepal.Width > 3.4) %>%
  head()
  Sepal.Length Sepal.Width Petal.Length Petal.Width Species
1          5.1         3.5          1.4         0.2  setosa
2          5.0         3.6          1.4         0.2  setosa
3          5.4         3.9          1.7         0.4  setosa
4          5.4         3.7          1.5         0.2  setosa
5          5.8         4.0          1.2         0.2  setosa
6          5.7         4.4          1.5         0.4  setosa

iris %>% 
  head() %>%
  filter(Sepal.Width > 3.4) 
  Sepal.Length Sepal.Width Petal.Length Petal.Width Species
1          5.1         3.5          1.4         0.2  setosa
2          5.0         3.6          1.4         0.2  setosa
3          5.4         3.9          1.7         0.4  setosa

와는 결과가 다름

dplyr - multiple filter

iris %>% 
  filter(Sepal.Width > 3.4 & Sepal.Length > 5) %>%
  head()
  Sepal.Length Sepal.Width Petal.Length Petal.Width Species
1          5.1         3.5          1.4         0.2  setosa
2          5.4         3.9          1.7         0.4  setosa
3          5.4         3.7          1.5         0.2  setosa
4          5.8         4.0          1.2         0.2  setosa
5          5.7         4.4          1.5         0.4  setosa
6          5.4         3.9          1.3         0.4  setosa
iris %>% 
  filter(Sepal.Width > 3.4, Sepal.Length > 5) %>%
  head()

iris %>%
  filter(Sepal.Width > 3.4) %>%
  filter(Sepal.Length > 5) %>%
  head()

dplyr - arrange (sort)

head(iris)
  Sepal.Length Sepal.Width Petal.Length Petal.Width Species
1          5.1         3.5          1.4         0.2  setosa
2          4.9         3.0          1.4         0.2  setosa
3          4.7         3.2          1.3         0.2  setosa
4          4.6         3.1          1.5         0.2  setosa
5          5.0         3.6          1.4         0.2  setosa
6          5.4         3.9          1.7         0.4  setosa
iris %>% 
  arrange(Sepal.Length) %>% 
  head()
  Sepal.Length Sepal.Width Petal.Length Petal.Width Species
1          4.3         3.0          1.1         0.1  setosa
2          4.4         2.9          1.4         0.2  setosa
3          4.4         3.0          1.3         0.2  setosa
4          4.4         3.2          1.3         0.2  setosa
5          4.5         2.3          1.3         0.3  setosa
6          4.6         3.1          1.5         0.2  setosa

dplyr - arrange 2

iris %>% 
  arrange(-Sepal.Length) %>% 
  head()
  Sepal.Length Sepal.Width Petal.Length Petal.Width   Species
1          7.9         3.8          6.4         2.0 virginica
2          7.7         3.8          6.7         2.2 virginica
3          7.7         2.6          6.9         2.3 virginica
4          7.7         2.8          6.7         2.0 virginica
5          7.7         3.0          6.1         2.3 virginica
6          7.6         3.0          6.6         2.1 virginica
iris %>% 
  arrange(desc(Sepal.Length))

dplyr - select

iris %>% 
  head()
  Sepal.Length Sepal.Width Petal.Length Petal.Width Species
1          5.1         3.5          1.4         0.2  setosa
2          4.9         3.0          1.4         0.2  setosa
3          4.7         3.2          1.3         0.2  setosa
4          4.6         3.1          1.5         0.2  setosa
5          5.0         3.6          1.4         0.2  setosa
6          5.4         3.9          1.7         0.4  setosa
iris %>% 
  select(Sepal.Length, Sepal.Width, Species) %>%
  head()
  Sepal.Length Sepal.Width Species
1          5.1         3.5  setosa
2          4.9         3.0  setosa
3          4.7         3.2  setosa
4          4.6         3.1  setosa
5          5.0         3.6  setosa
6          5.4         3.9  setosa

dplyr - select 2

  • 제외
iris %>% 
  select(-Species) %>%
  head()
  • 범위 선택
iris %>% 
  select(Sepal.Width:Petal.Width) %>%
  head()

iris %>% 
  select(2, 3, 4) %>%
  head()
  • 조건
iris %>% 
  select(ends_with('Width')) %>%
  head()
  • start_with(“ABC”): 로 시작
  • end_with(“XYZ”): 로 끝
  • contains(“IJK”): 를 포함하는
  • one_of(c(“A”,“B”,“C”)): 에 속해있는
  • num_range(“Day”, 10:15): 더하기
  • matches(“[pt]al”): Regular Expression

dplyr - mutate

iris %>% 
  head()
  Sepal.Length Sepal.Width Petal.Length Petal.Width Species
1          5.1         3.5          1.4         0.2  setosa
2          4.9         3.0          1.4         0.2  setosa
3          4.7         3.2          1.3         0.2  setosa
4          4.6         3.1          1.5         0.2  setosa
5          5.0         3.6          1.4         0.2  setosa
6          5.4         3.9          1.7         0.4  setosa
iris %>% 
  mutate(Sepal.Length = round(Sepal.Length)) %>%
  head()
  Sepal.Length Sepal.Width Petal.Length Petal.Width Species
1            5         3.5          1.4         0.2  setosa
2            5         3.0          1.4         0.2  setosa
3            5         3.2          1.3         0.2  setosa
4            5         3.1          1.5         0.2  setosa
5            5         3.6          1.4         0.2  setosa
6            5         3.9          1.7         0.4  setosa
iris %>% 
  mutate(
    Species2 = ifelse(
      Species == 'setosa', 'setosa', 'etc'
    ) 
  ) %>% 
  View() # TRY 

dplyr - group by & summarise

보통 둘이 같이 씀

baseR의 aggregation과 유사한 목적

iris %>% 
  head()
  Sepal.Length Sepal.Width Petal.Length Petal.Width Species
1          5.1         3.5          1.4         0.2  setosa
2          4.9         3.0          1.4         0.2  setosa
3          4.7         3.2          1.3         0.2  setosa
4          4.6         3.1          1.5         0.2  setosa
5          5.0         3.6          1.4         0.2  setosa
6          5.4         3.9          1.7         0.4  setosa
iris %>% 
  filter(Species=='setosa') %>% 
  pull(Sepal.Length) %>%
  mean()
[1] 5.006
iris %>% 
  group_by(Species) %>%
  summarise(
    mSL = mean(Sepal.Length),
    mSW = mean(Sepal.Width),
    count = n() # 개수
  )
# A tibble: 3 × 4
  Species      mSL   mSW count
  <fct>      <dbl> <dbl> <int>
1 setosa      5.01  3.43    50
2 versicolor  5.94  2.77    50
3 virginica   6.59  2.97    50

dplyr - inner_join

baseR의 merge와 유사한 목적

by로 공통 column 설정 merge에서 all.X & all.Y로 남길 값 선택했는데 여기서는 left_join, right_join으로 사용

Diagram으로 보는 Join의 종류

band_members
# A tibble: 3 × 2
  name  band   
  <chr> <chr>  
1 Mick  Stones 
2 John  Beatles
3 Paul  Beatles
band_instruments
# A tibble: 3 × 2
  name  plays 
  <chr> <chr> 
1 John  guitar
2 Paul  bass  
3 Keith guitar
band_members %>% 
  inner_join(band_instruments)
# A tibble: 2 × 3
  name  band    plays 
  <chr> <chr>   <chr> 
1 John  Beatles guitar
2 Paul  Beatles bass  

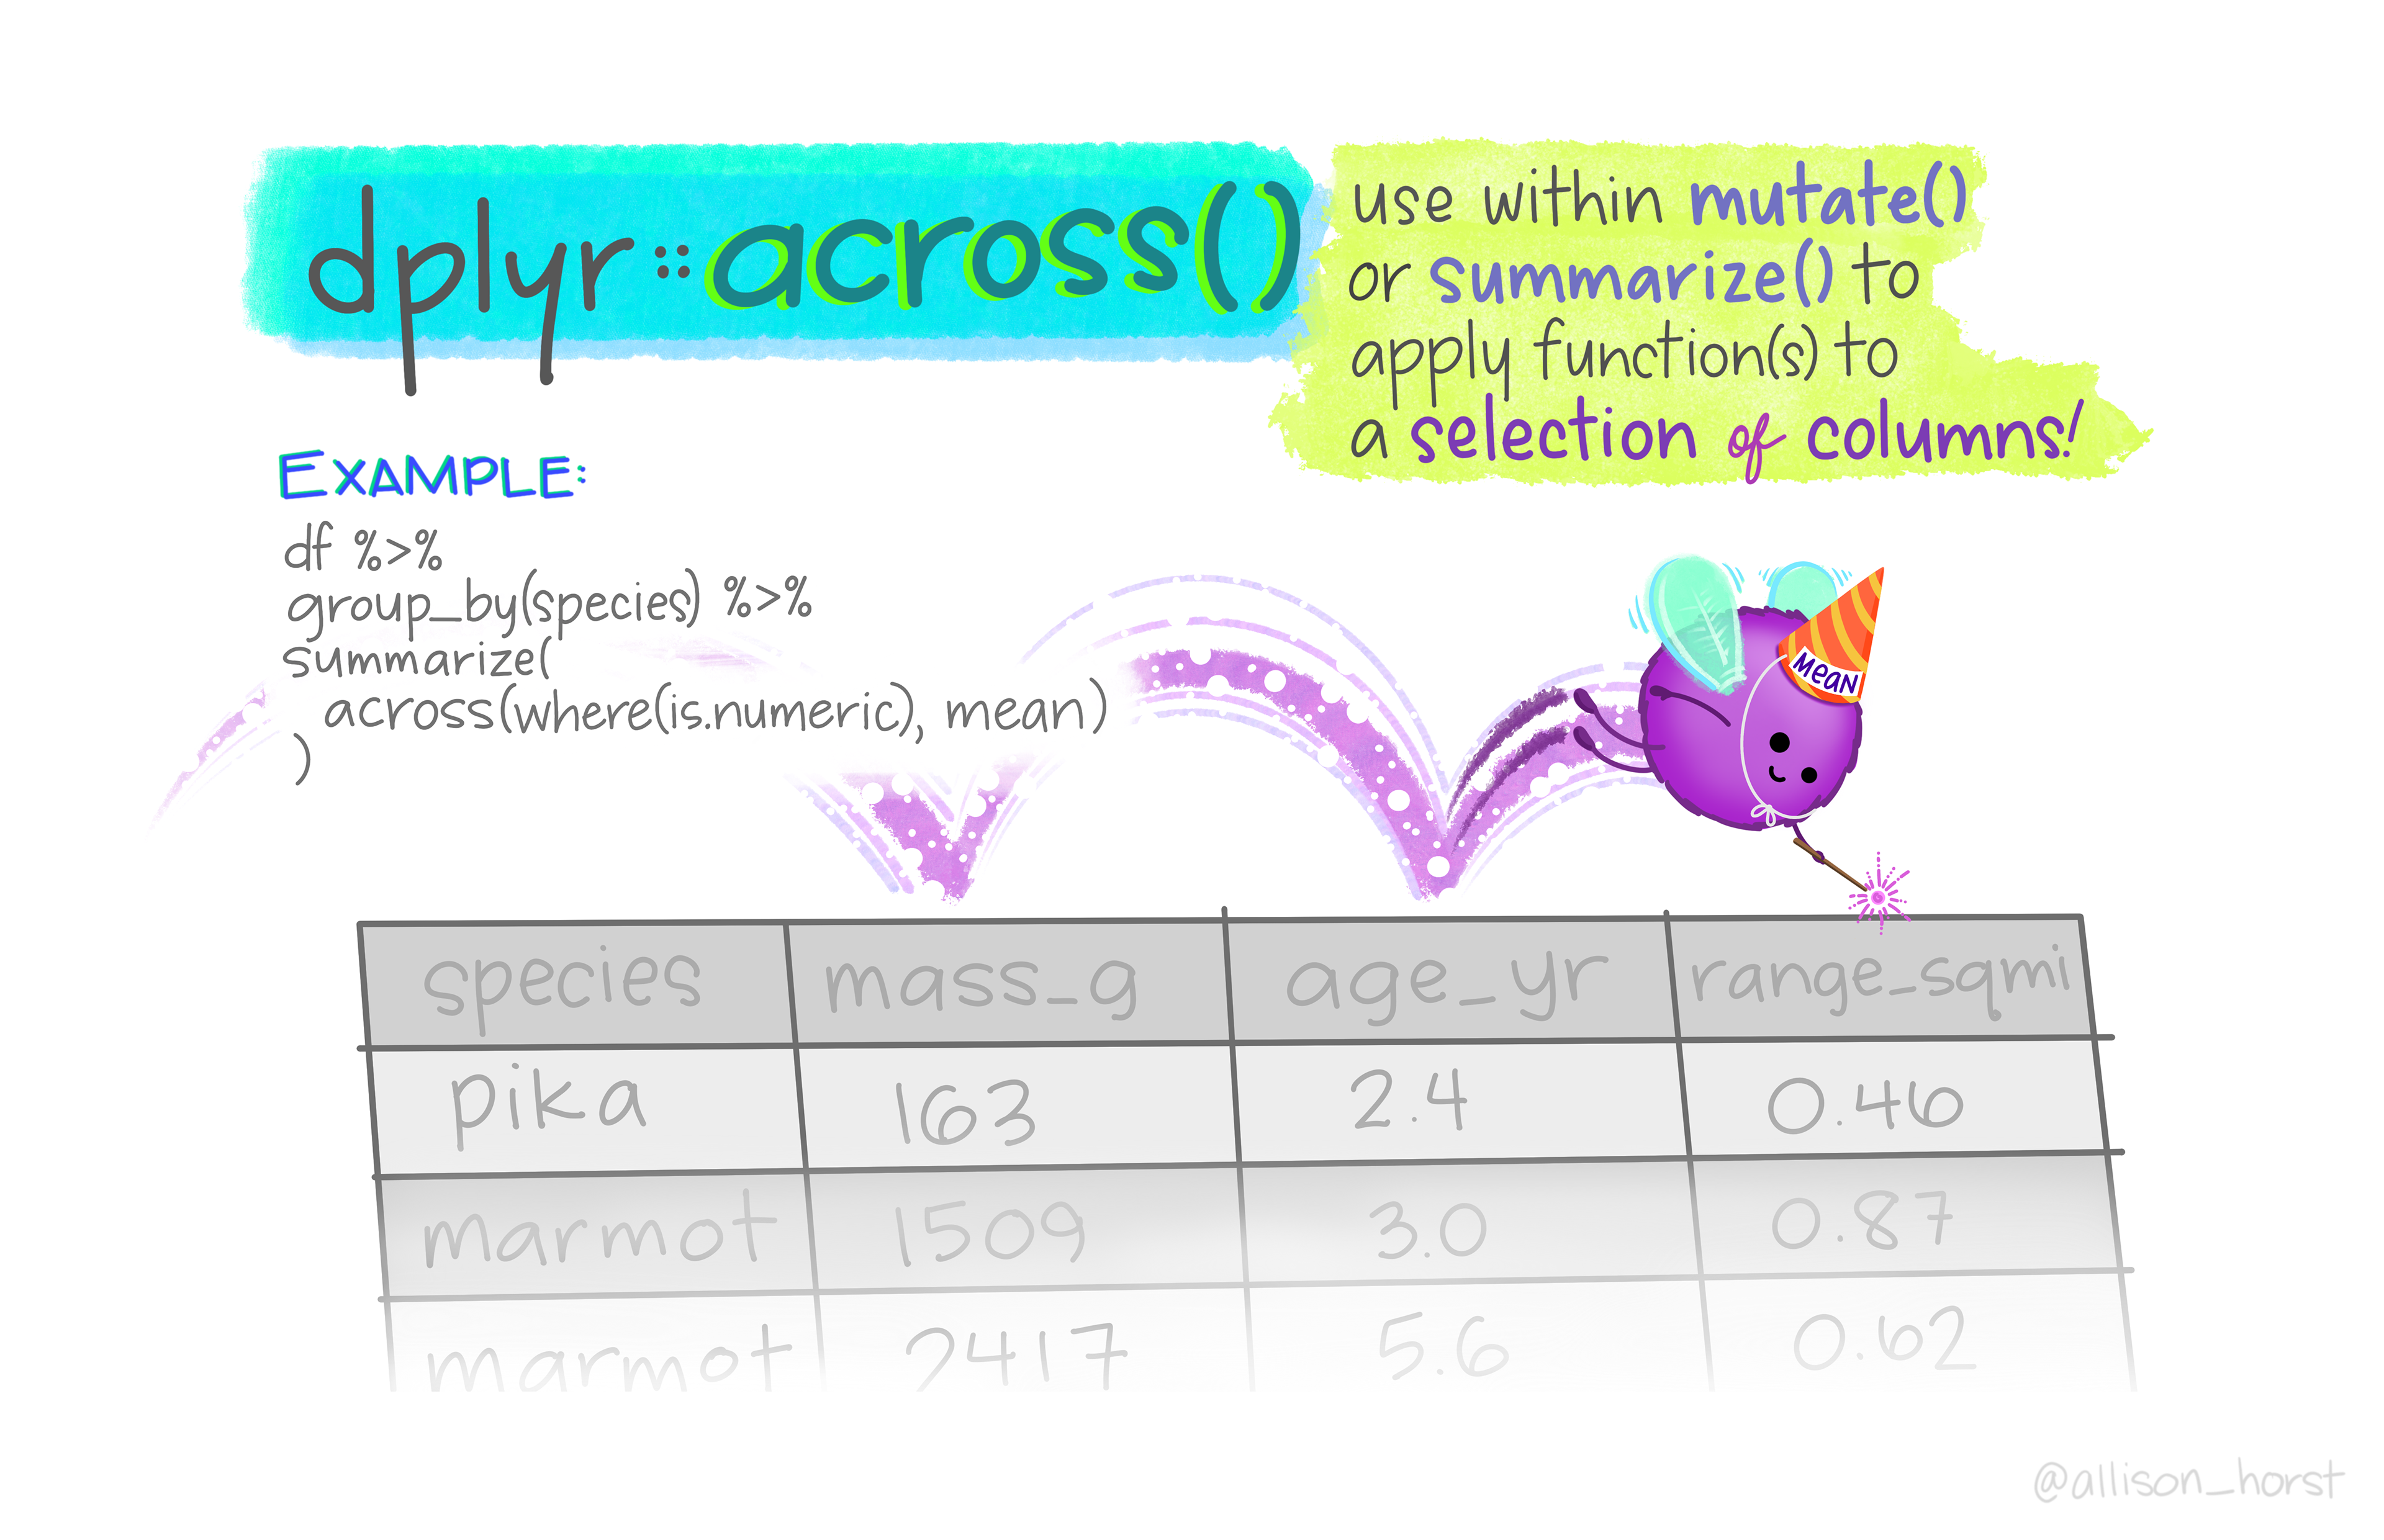
추가 자료: across

column들을 프로그래밍적으로 선택

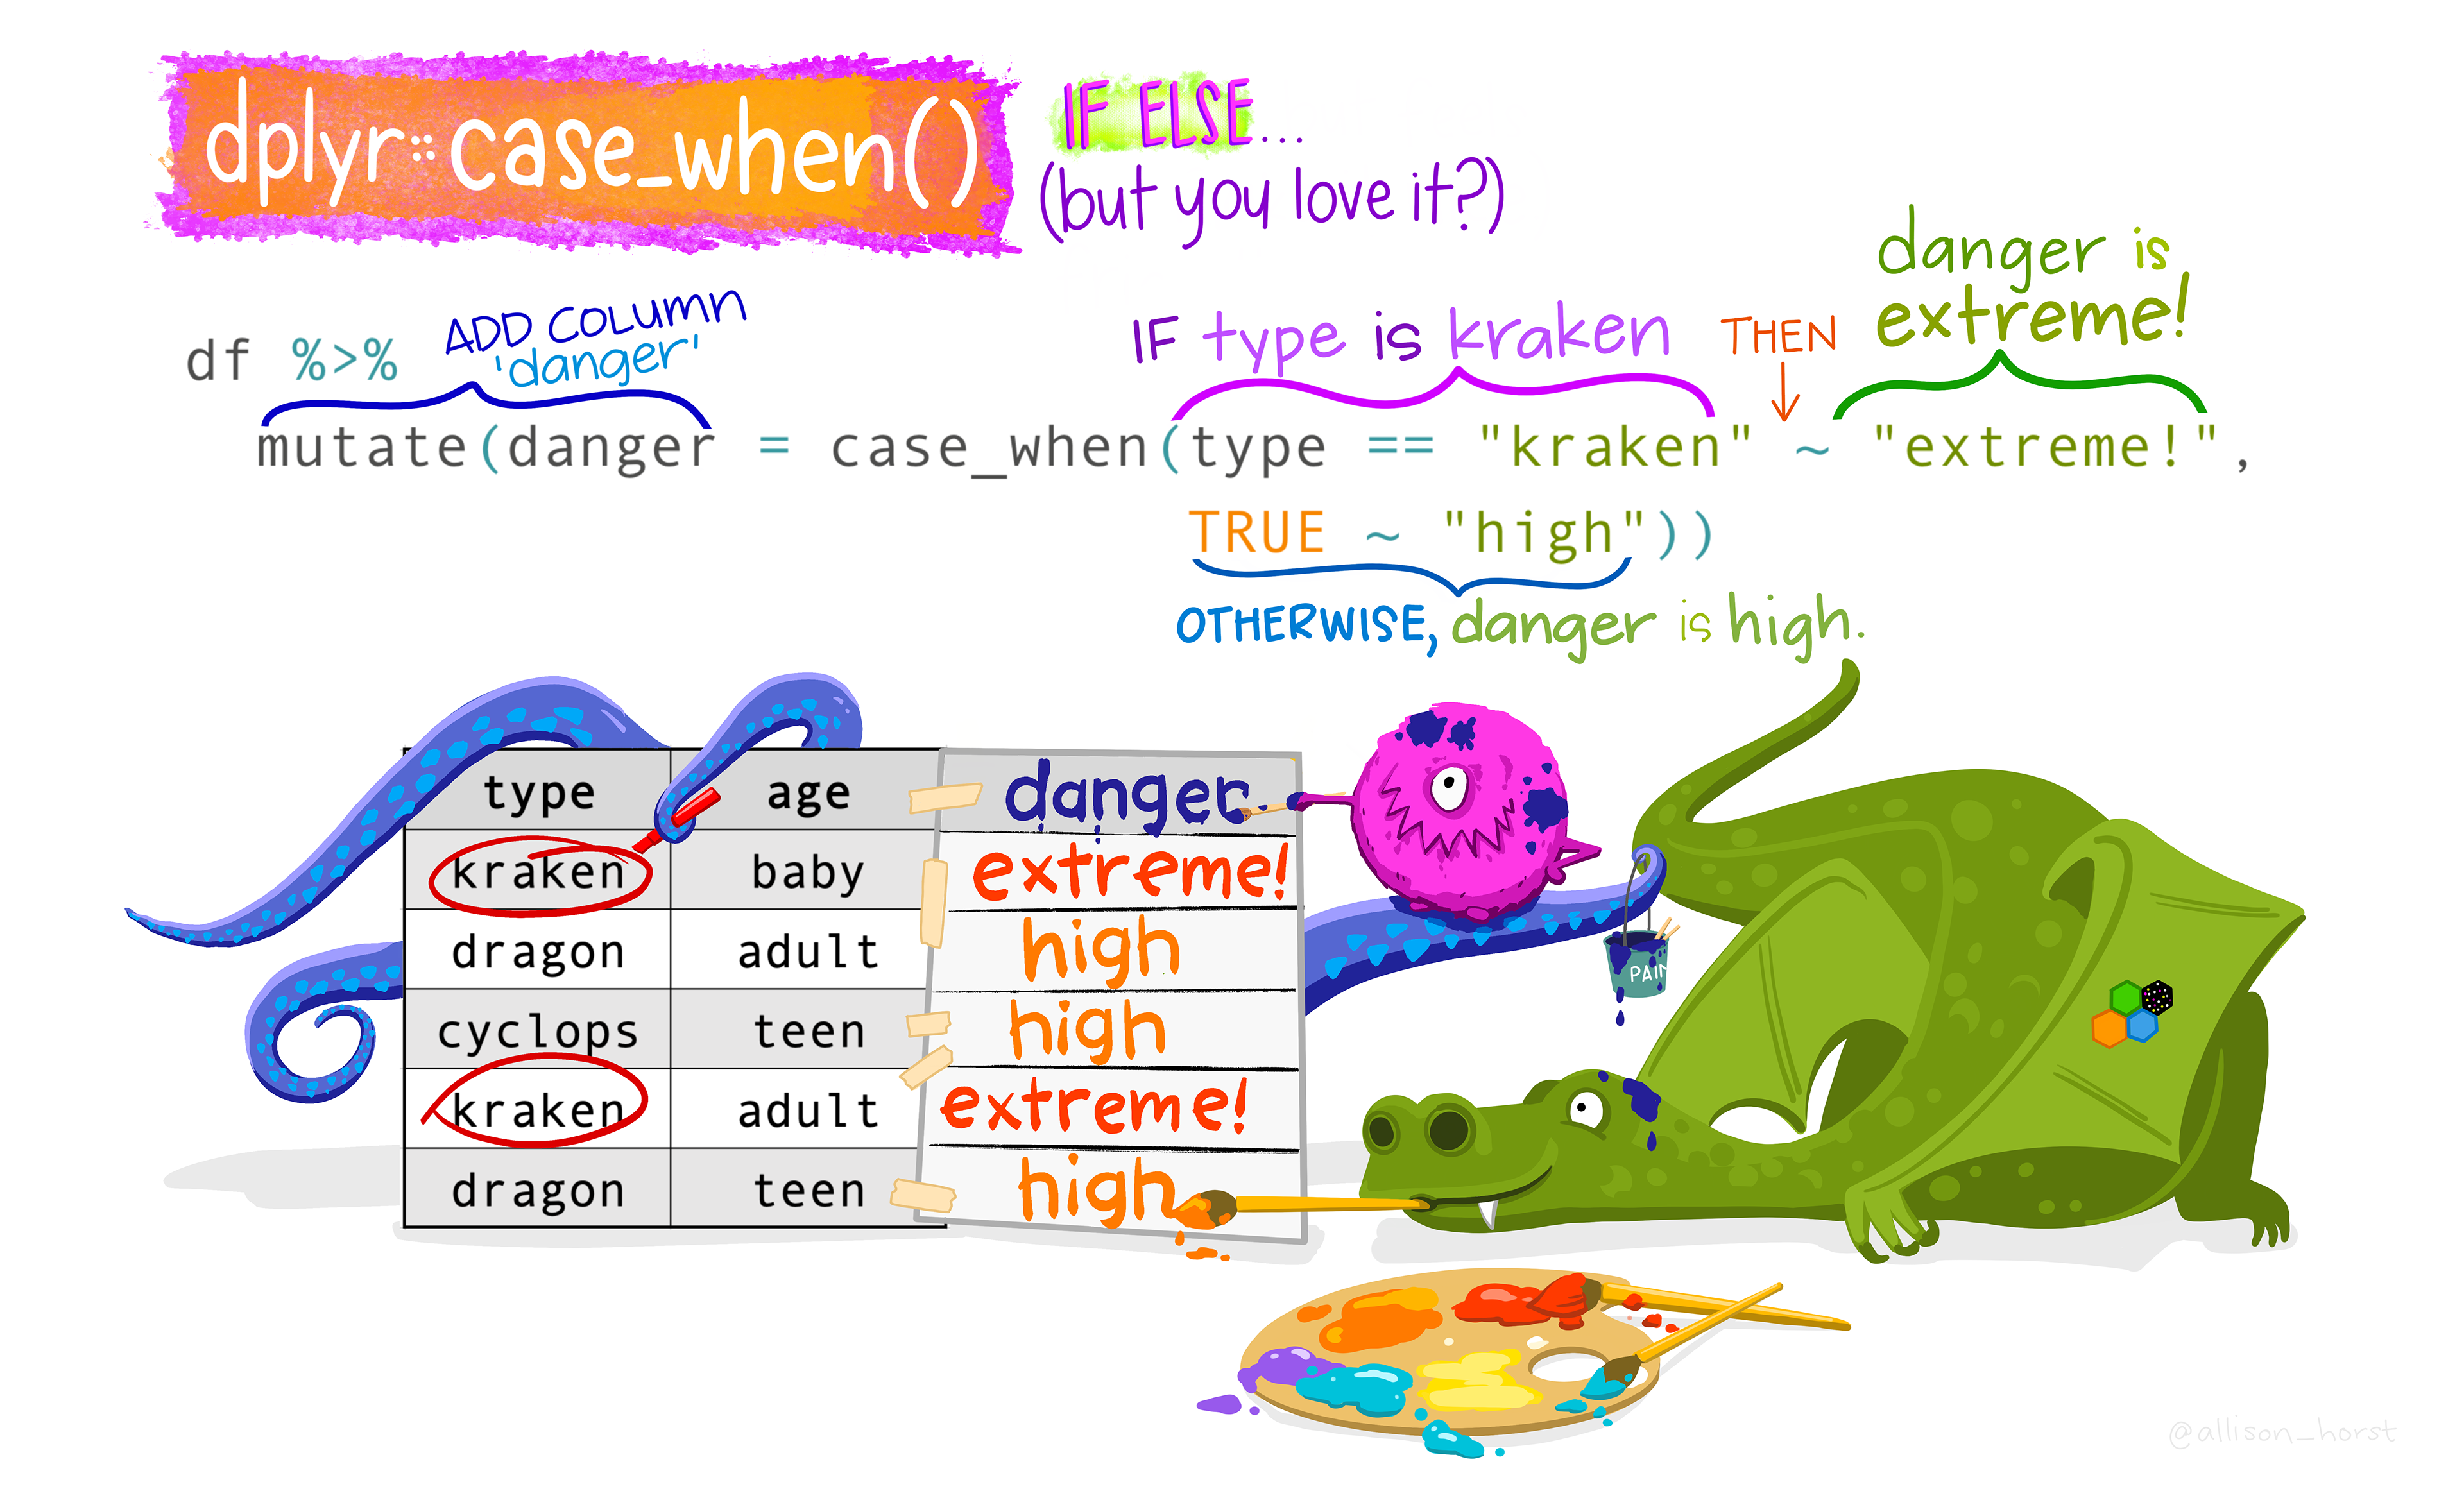
추가 자료: case_when

ifelse와 유사
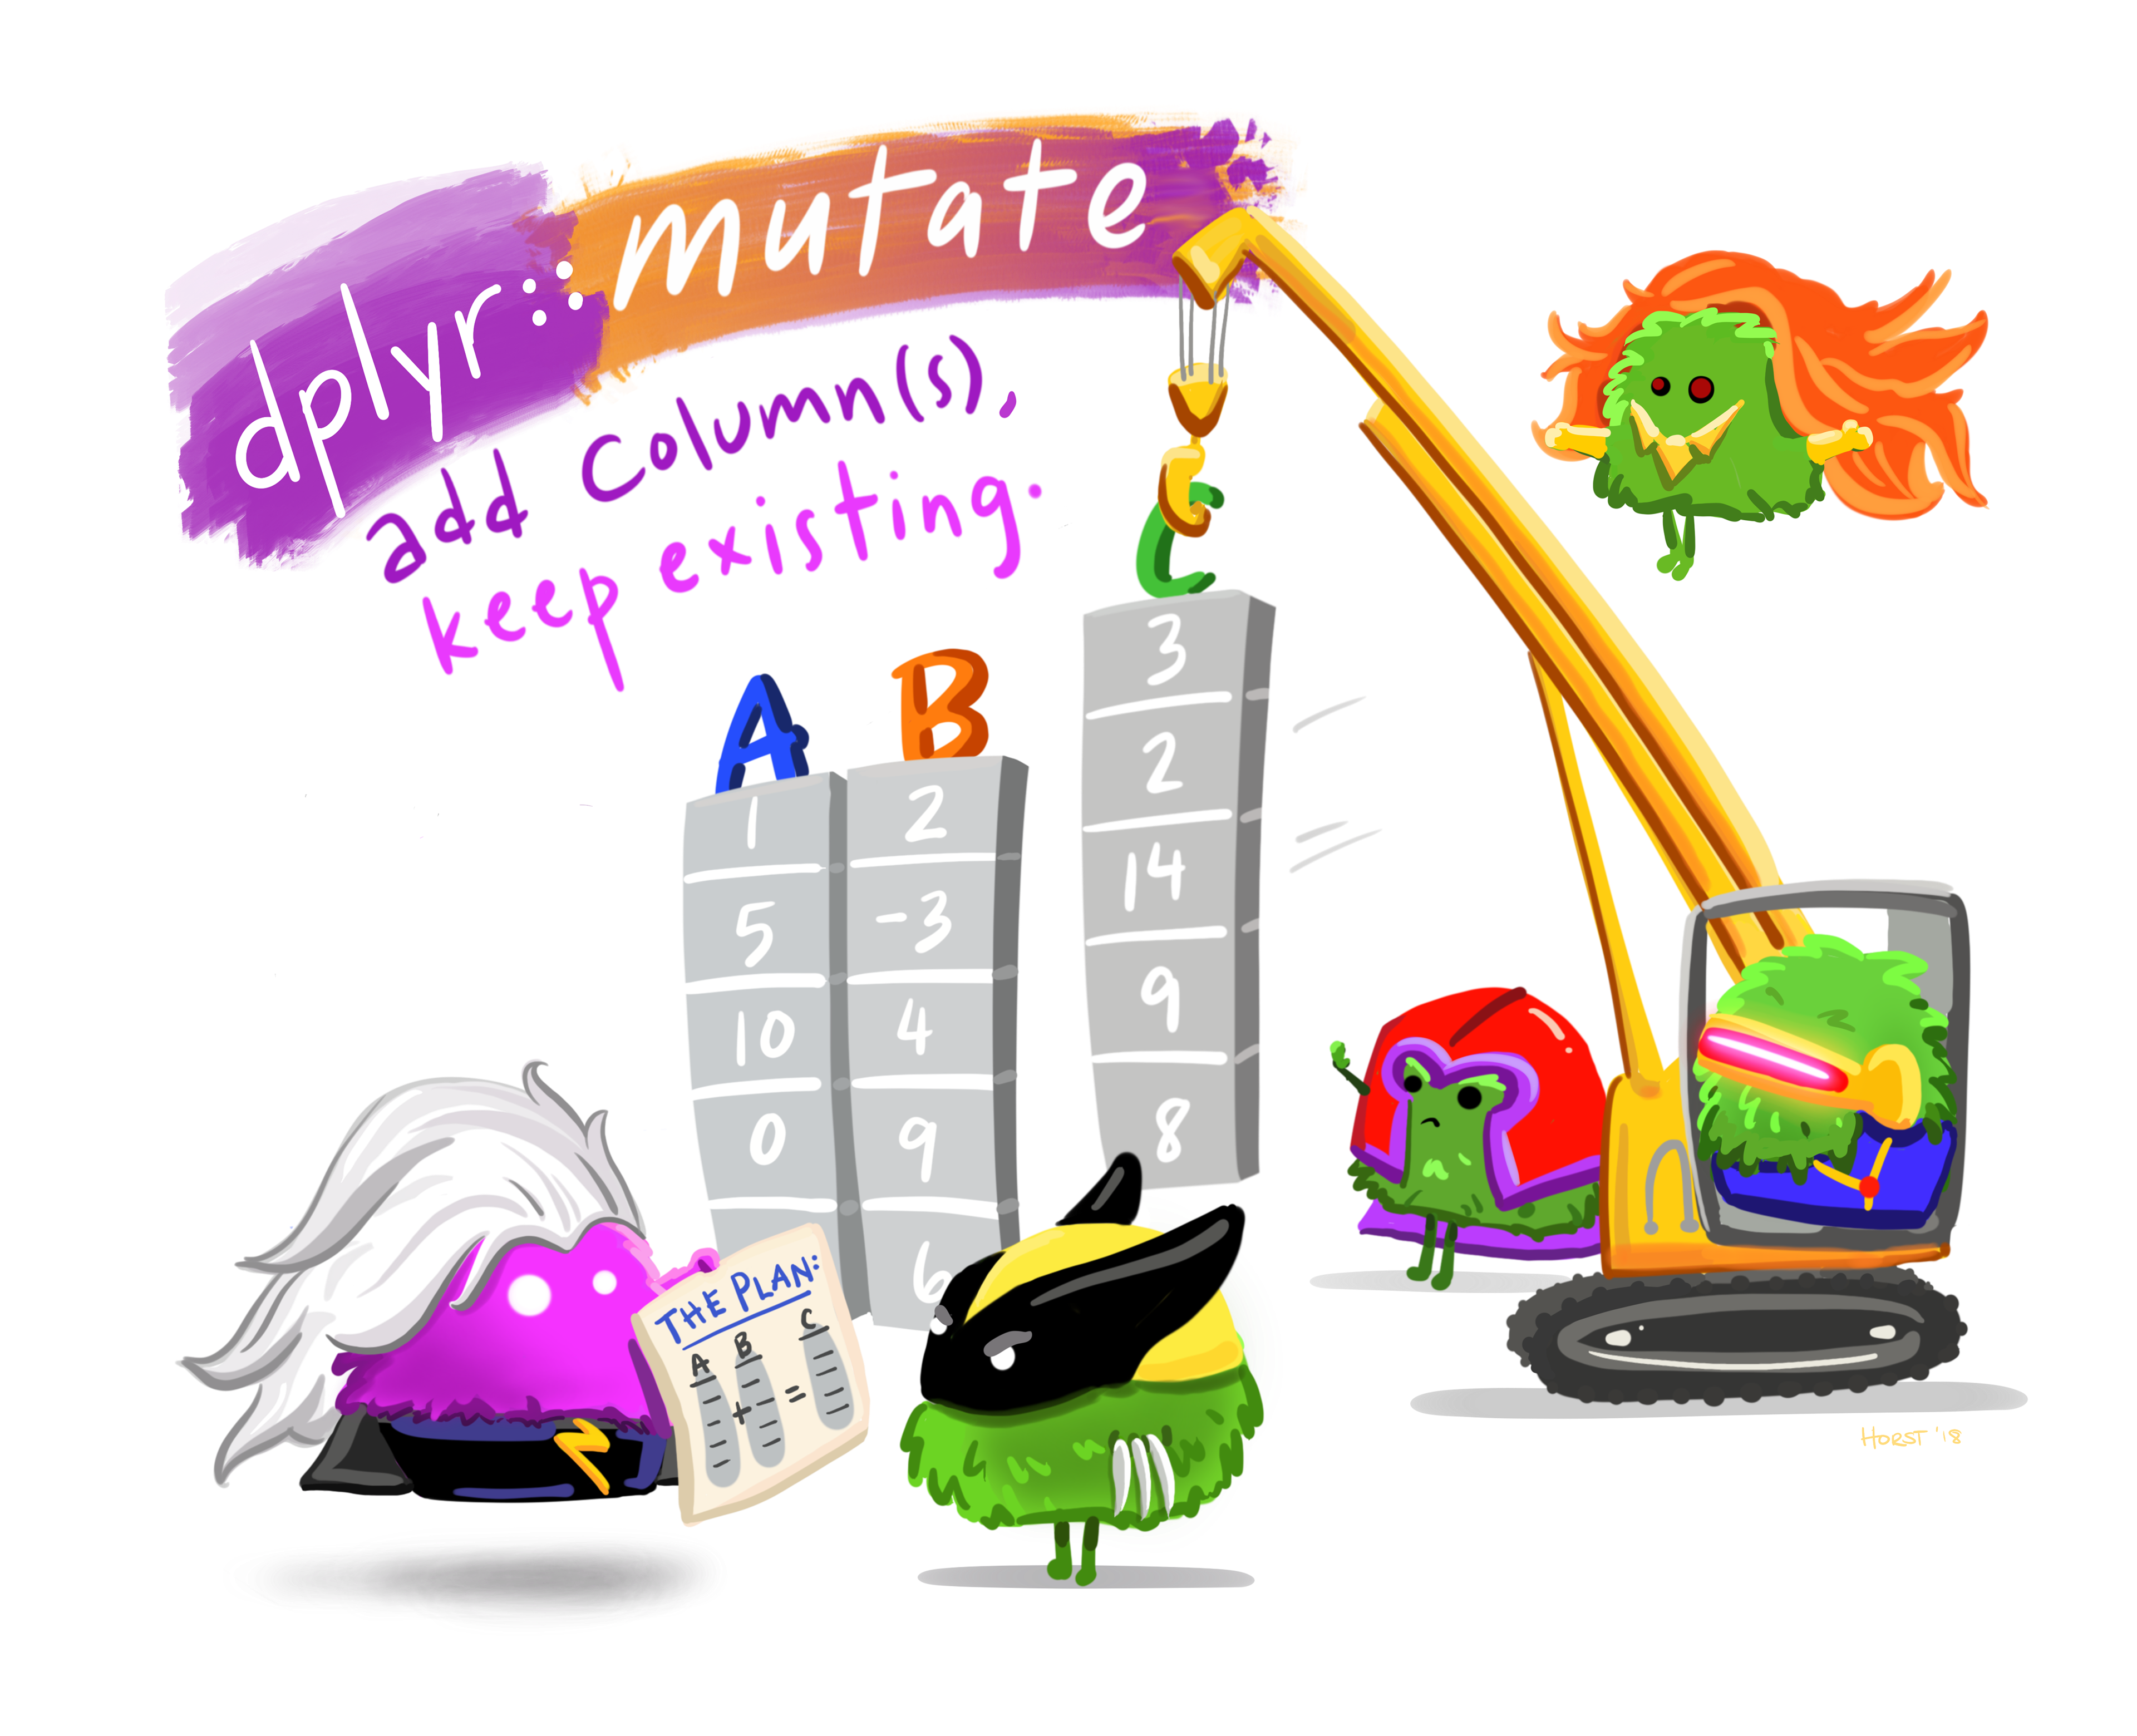
추가 자료: mutate
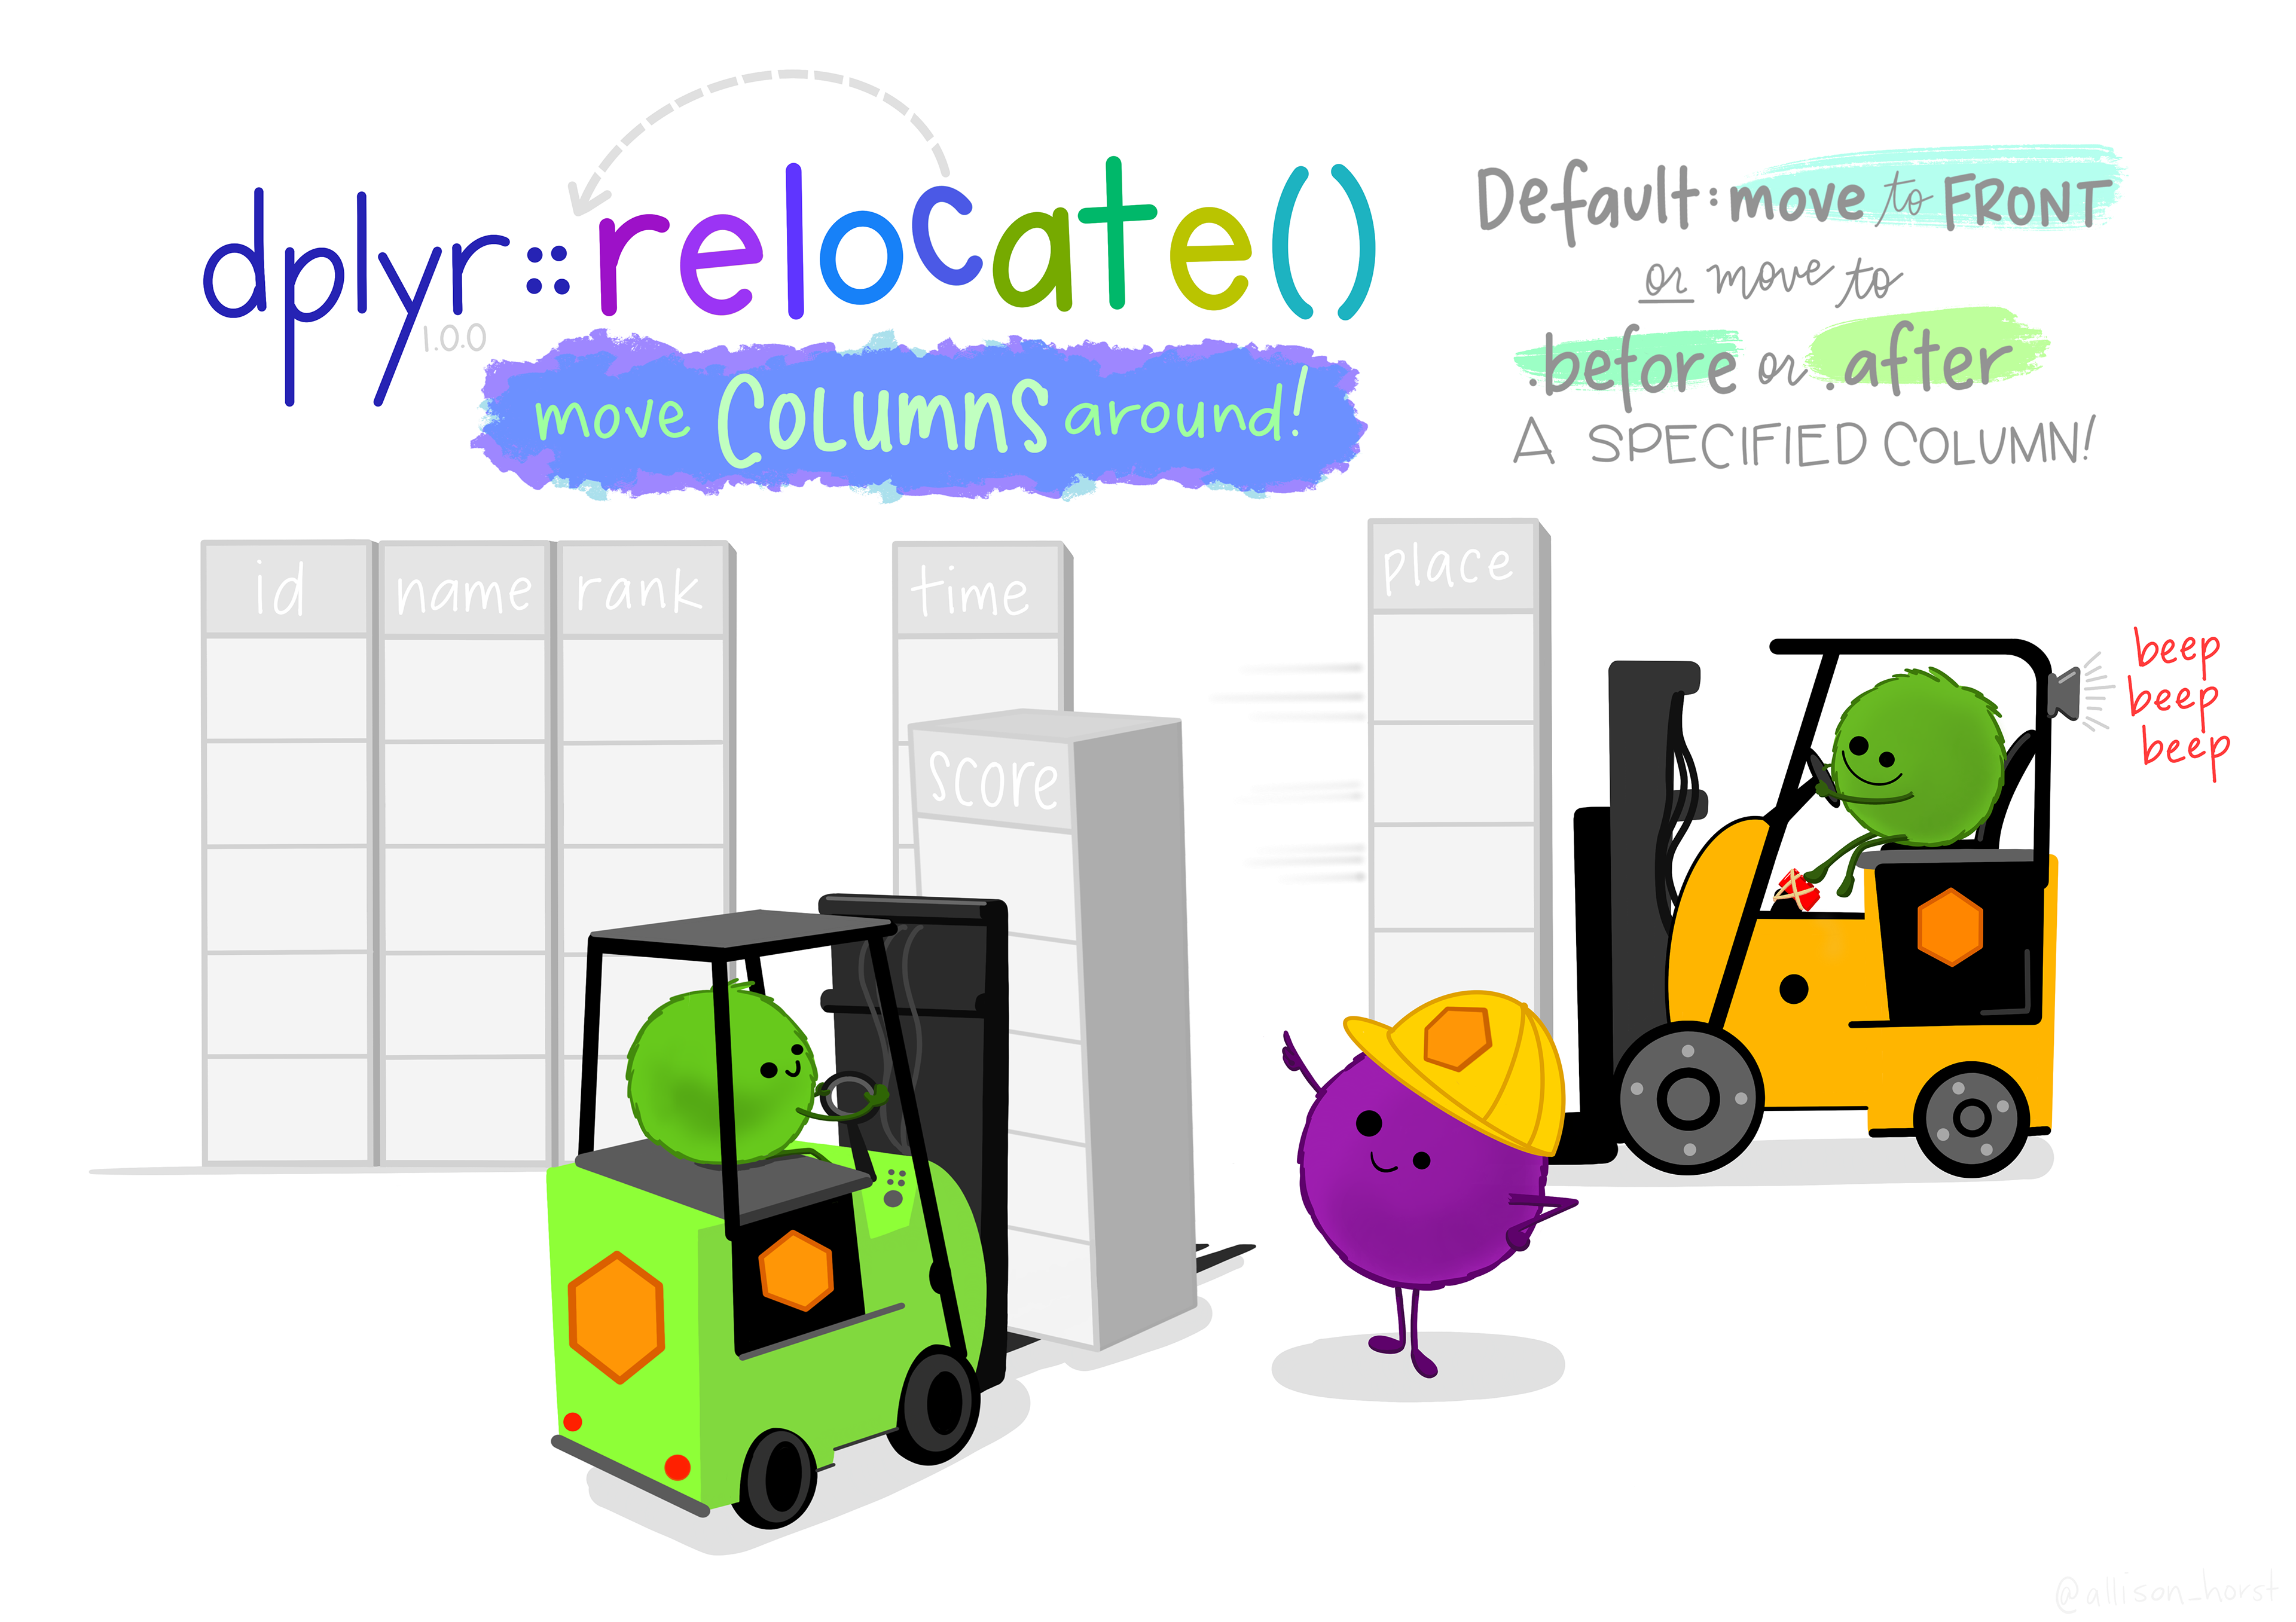
추가 자료: relocate

column의 순서 변경
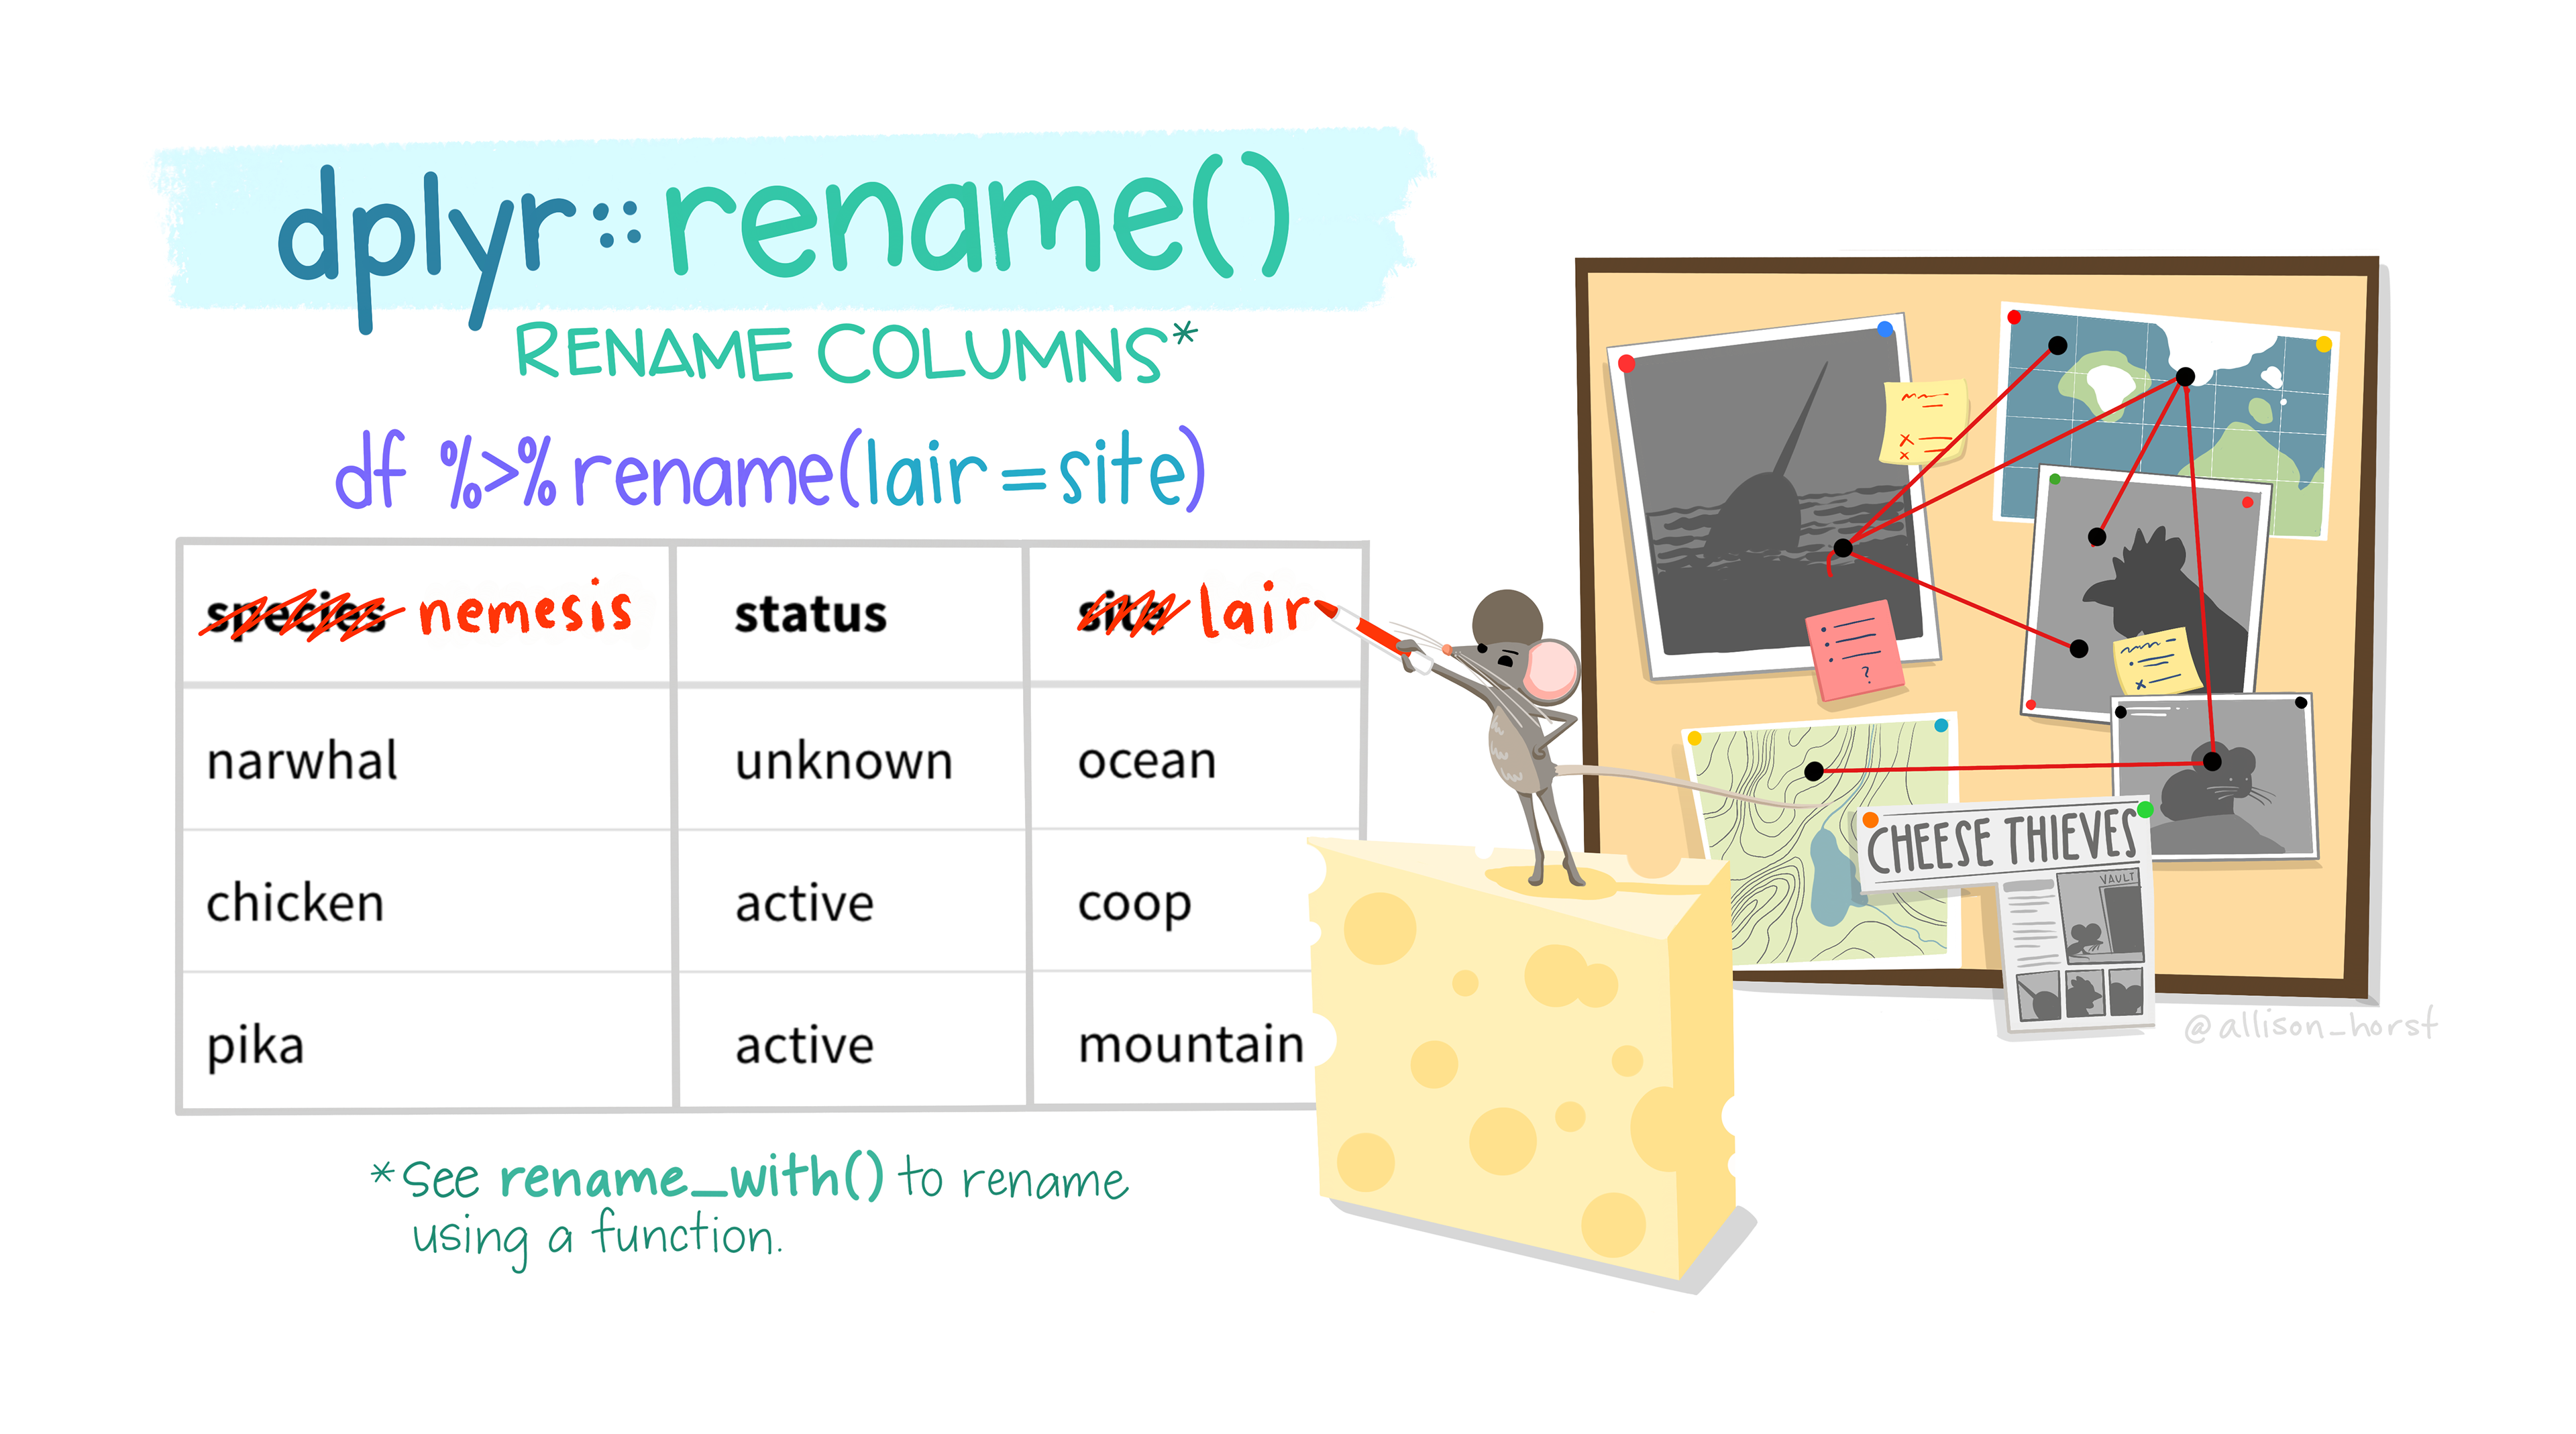
추가 자료: rename

column의 이름 변경. 자주 씀
정리

  • dplyr%>%와 함께 데이터를 변환하는 패키지

  • 5개의 주요 함수는 익숙해지면 좋음.

    • mutate
    • select
    • filter
    • arrange
    • group_by & summarise
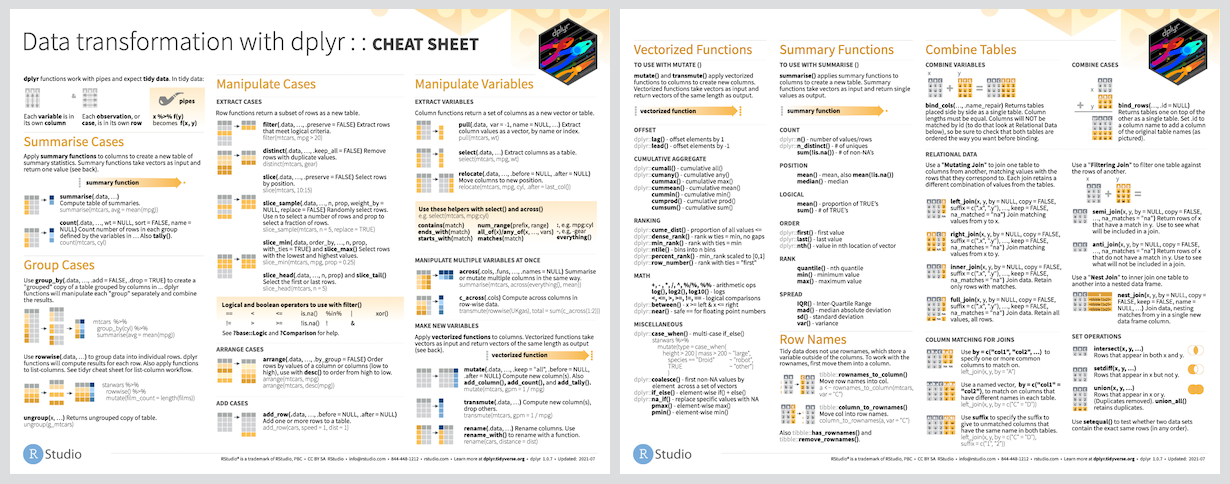
  • 더 많은 정보: Introduction to dplyr 아티클

  • 추가자료의 일러스트는 Allison Horst의 작품

    • dplyr외에도 다른 좋은 일러스트도 많음 !